Production Volume Changes That Signal Demand Shifts
Sector expansion signals opportunity, but plant-level signals close the actual deal.

U.S. Manufacturing PMI rebounded to 51.4 in June 2026 after months below 50. The ISM Production Index hit a notably high reading in July, the highest reading in nearly five years, with new orders picking up speed behind it. To a seller, that says one thing: demand across the sector is rising off the floor. The instinct is to treat the headline number like it's telling you where to point the phone. That instinct is worth resisting.
The sub-indexes carry the real information, and most reps never open them up. ISM builds its composite from New Orders, Production, Employment, Supplier Deliveries, and Inventories. If you sell a consumable, two of those matter and the rest are mostly noise for your purposes. New Orders and Production point at near-term replenishment buying. Employment tells you about a plant's staffing plans, which matters eventually, but not for a call you're making this week.
Averages hide almost as much as they show. A national index can post expansion while a good chunk of individual plants sit underneath it, quietly contracting. July's ISM panelist commentary described the market as "very opportunistic and reactive," with some customers cutting inventory while others pull demand forward, and one panelist put it plainly: "as many customers slowing down as growing." That's share moving around, plant by plant, account by account. Treating a rising headline as a tide lifting everything at once is how a rep ends up calling on a shrinking account because the sector number looked good.
PMI tells you which sectors deserve more attention this quarter. It has nothing to say about which of the forty plants in your territory is worth a call next Tuesday. You still have to go find that plant yourself.
Which sectors are expanding production right now and what that means for sellers in each
Fifteen manufacturing industries reported production growth in July's ISM data. Fabricated Metal Products, Plastics and Rubber Products, Transportation Equipment, Computer and Electronic Products, and Machinery all made the list. Chemical Products was the lone industry in contraction that month, and that single line matters more than the other fourteen combined if chemical manufacturers make up any real share of your book.
Fabricated Metals and Machinery expanding means more machining hours, plain and simple. More machining hours means higher fluid consumption and faster sump turnover for anyone selling metalworking fluid, because the fluid burns off as a byproduct of running the machines, and there's no putting that off. A plant manager can defer a capital purchase for a quarter. He cannot defer replenishing a sump that's run dry.
Aerospace and defense deserve their own line item, and I'd argue more attention than most reps give them. June's ISM sourcing managers reported strong demand there, offsetting weakness in consumer goods. Grinding is the fastest-growing application inside metalworking fluids, projected at a 6.12% CAGR, and a plant running active aerospace machining programs is a structurally valuable account regardless of what its headcount looks like on paper.
Electrification is opening entirely new categories, adding to what's already growing rather than simply expanding it. Shell Lubricants' 2025 partnership with a Chinese EV manufacturer to develop metalworking fluids for EV component production is worth knowing about for exactly this reason: a plant adding EV drivetrain machining is a fresh qualification opportunity, often a different chemistry entirely from whatever fluid relationship already sits in place.
Chemical Products in contraction is a warning worth flagging, especially if your book skews toward chemical manufacturing. Don't assume last quarter's run rate holds. Go check the current production schedule before building a forecast on a number that's already gone stale.
None of it closes the gap by itself, though. Knowing Fabricated Metals is expanding nationally doesn't tell you which of the several hundred fabricated metal plants in your territory actually added a shift last month. Sector data narrows the search. The call list still gets built plant by plant, one confirmed signal at a time.
The specific plant-level changes that precede a purchasing decision
Capacity expansion is the clearest signal there is, and it's the one I'd chase first every time. A plant adding a building, a new line, or an extra shift is about to need more of everything it already buys. New product qualifications almost always happen before the line starts running, which means by the time the line goes live, the vendor decision is usually already made. Show up after that and you're too late; there's no polite way around it.
Equipment investment runs on the same clock but changes the product itself, not just the volume. A new machining center, press, or coating line usually needs its own fluid or chemical qualification, one that's frequently different from what the existing lines use. That's a new sale hiding inside an account you already own, and it's easy to miss if all you track is order history.
Hiring is a cheap signal, and cheap to check. A plant posting twenty machinist openings is staffing up for throughput that's coming, and that shows up on job boards well before it ever shows up as a purchase order.
CapEx announcements, environmental permits for new processes, planning approvals, earnings-call commentary about capital deployment: all of it precedes the physical production change by months, and it's public record. Reps working off a static account list they update twice a year, if that, ignore this constantly — a persistent gap, given how accessible most of this information is.
New customer wins matter especially in automotive supply chains. A Tier 1 supplier landing a new platform contract has to qualify its consumables before the first part ships, and that win often shows up in trade press long before production begins. Whoever's in the room when the spec gets written sets the evaluation criteria everyone else has to compete against. Arrive after the spec is locked and you're bidding on terms built for somebody else's product, which is a losing position dressed up as an opportunity.
There's a narrower, time-limited version of this signal worth naming on its own: pull-forward buying. April's ISM commentary showed customers ordering ahead of anticipated price increases, at a 1.6-to-1.0 ratio of positive to negative sentiment on the topic. That window closes fast, faster than most quarterly cadences can react to. It calls for urgency, well beyond a standard check-in scheduled six weeks out.
The signals run in reverse just as reliably, and get missed just as often. Inventory building up at a customer site, shift schedules getting trimmed, a line going quiet: each one precedes a purchasing pause. Catch it early and you manage the relationship on your terms. Miss it, and you find out about the pause when the renewal doesn't come through, which is a bad way to find out anything.
How specialty chemical and metalworking fluid demand connects to production volume at the facility level
The U.S. specialty chemicals market was valued at $204.49 billion in 2025, with growth projected through 2034. That's a large enough pool that even a modest gain in targeting accuracy turns into real revenue for an individual rep, not just a rounding error on a slide.
Chemical procurement starts with a demand forecast for the finished product, not a material request, which is a distinction people miss constantly. A plant's production forecast is, functionally, also its chemical buyer's purchasing forecast, because the two numbers move together and have to.
Look at CASE (coatings, adhesives, sealants, elastomers), which held 38.9% of the specialty chemicals market in 2025, pushed along by construction, automotive, and infrastructure demand. A plant ramping up automotive body panel output is signaling coating and adhesive consumption growth well before procurement files anything formal.
Sustainability commitments are their own trigger, and an underused one at that. Eco-friendly specialty chemicals made up 28% of new product launches in 2025. A plant announcing sustainability targets, or facing new environmental permitting, often kicks off a reformulation review. That review is an opening, but only for a seller who already understands the plant's current process well enough to offer an alternative on the spot. Show up needing to go research it first and somebody else has already had the conversation.
Metalworking fluids tell a similar story. The global market reached $13.6 billion in 2025, with soluble oil holding around 40.3% share. Synthetic fluids are the faster-growing segment, projected at a 6.43% CAGR, and a plant migrating from soluble to synthetic is a cross-sell and upgrade opportunity sitting in plain sight. It shows up to a rep tracking the plant's actual process changes, well ahead of any purchase-history report, since purchase history only tells you what already happened.
Machining accounts for 41.58% of fluid application share, but grinding is growing fastest, pushed by aerospace and medical parts work. A plant adding grinding capacity for tight-tolerance parts telegraphs that shift through equipment orders and hiring patterns months before fluid consumption itself changes. North America is the fastest-growing region for metalworking fluids, projected at a 6.66% CAGR through 2033, driven by automation, more sophisticated machining, and aerospace production. For reps working North American territory, that's reason enough to weight time toward plants already showing these signals, rather than spreading effort evenly across the map just because that's how the territory has always been carved up.
Why generic company data fails to surface these signals (and what plant-level data actually looks like)
A NAICS code and an employee count describe what a company does on paper. Neither one tells you what a specific facility is actually producing, on which lines, at what volume, through what process. That gap is where most territory planning quietly falls apart, and nobody notices until the pipeline runs dry and somebody starts asking uncomfortable questions in the Monday meeting.
Take a record that reads "metal fabrication, 500 employees." It doesn't say whether that plant runs aluminum extrusion, steel stamping, or precision CNC work, and without that detail you have no real basis for knowing which fluids or chemicals it consumes. The buying decision behind a significant industrial purchase typically involves multiple stakeholders across the facility. Every one of those people reacts to what's happening on the actual production floor, not to whatever SIC code has sat untouched in a database since somebody typed it in years ago.
Stale CRM data makes the problem worse. If an account record reflects what a plant looked like eighteen months ago, any production change since then is invisible to the rep working that account. He ends up calling on a facility that, in practical terms, doesn't exist the way he thinks it does anymore.
Plant-level data covers what the facility actually makes, what processes run the floor, what equipment is installed, current capacity against actual output, environmental footprint indicators, and live activity like permit filings, job postings, and expansion announcements. That's a meaningful upgrade over a NAICS code, closer to a different category of information than a marginal improvement on the old one.
The commercial gap that opens up is stark. A rep who knows a plant added a second shift on its CNC turning center last quarter has a specific, current reason to pick up the phone. A rep working off a company-level NAICS record is making a cold call and telling himself it's warm. Pre-call research consumes time that, in a well-run operation, should already be sitting in front of a rep before they open the account. Multiply that across a territory and the hours add up to a productivity gap that compounds every quarter, quietly, until someone finally asks why the pipeline looks thin.
Turning production signals into a prioritized call sequence across a territory
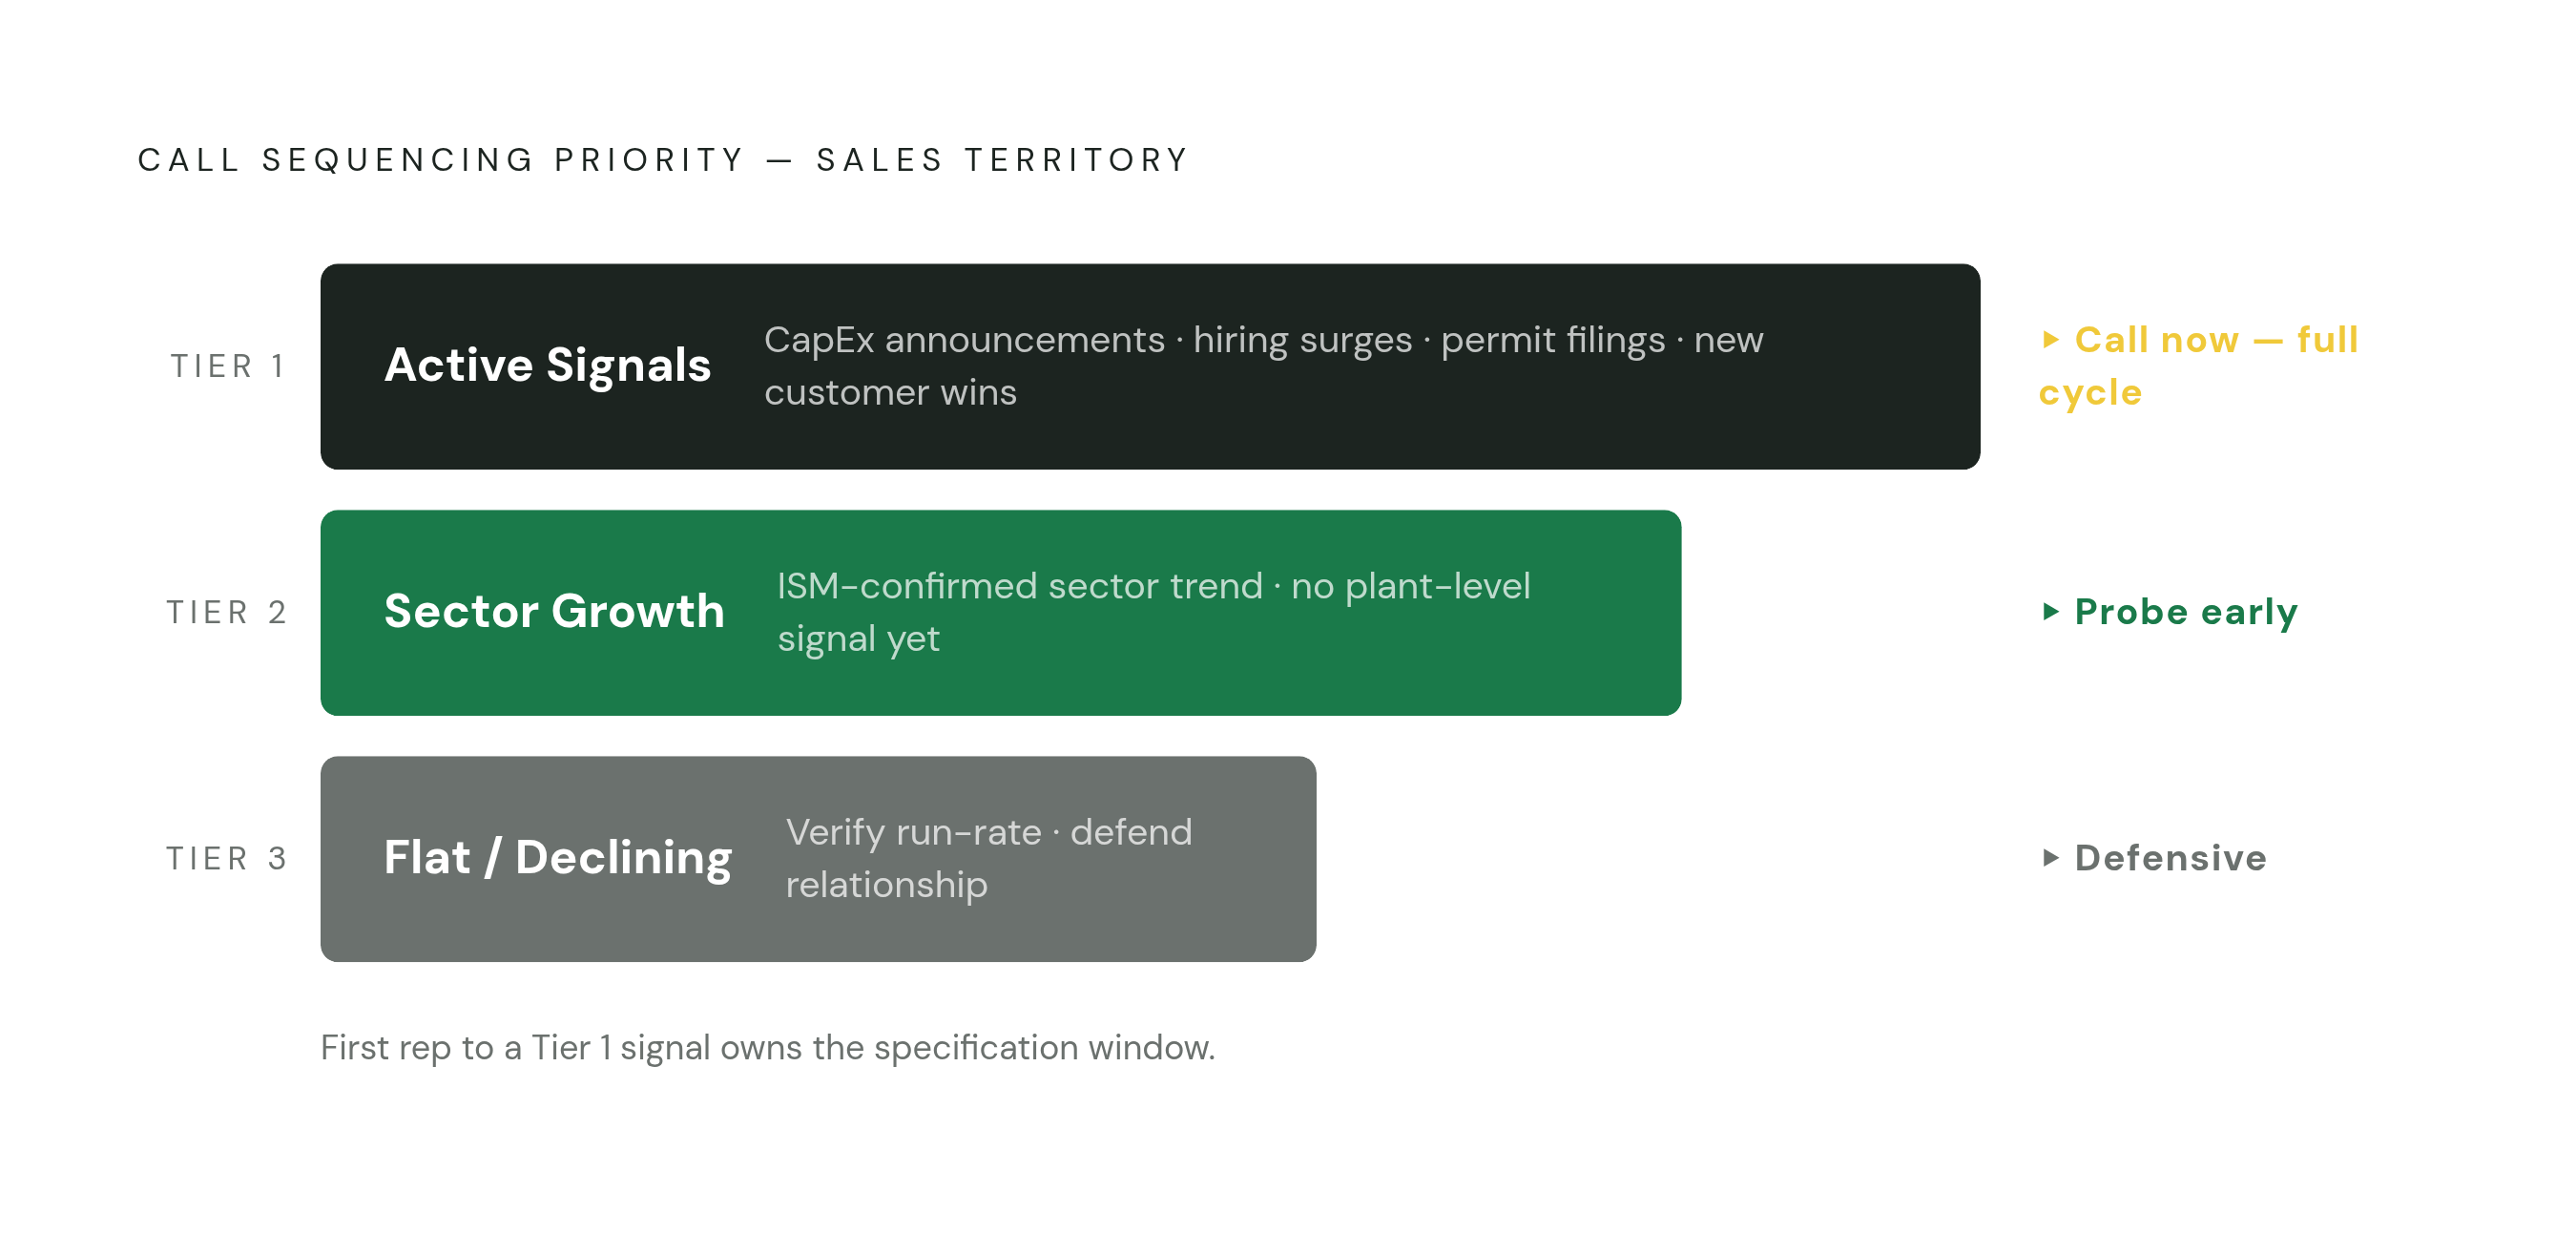
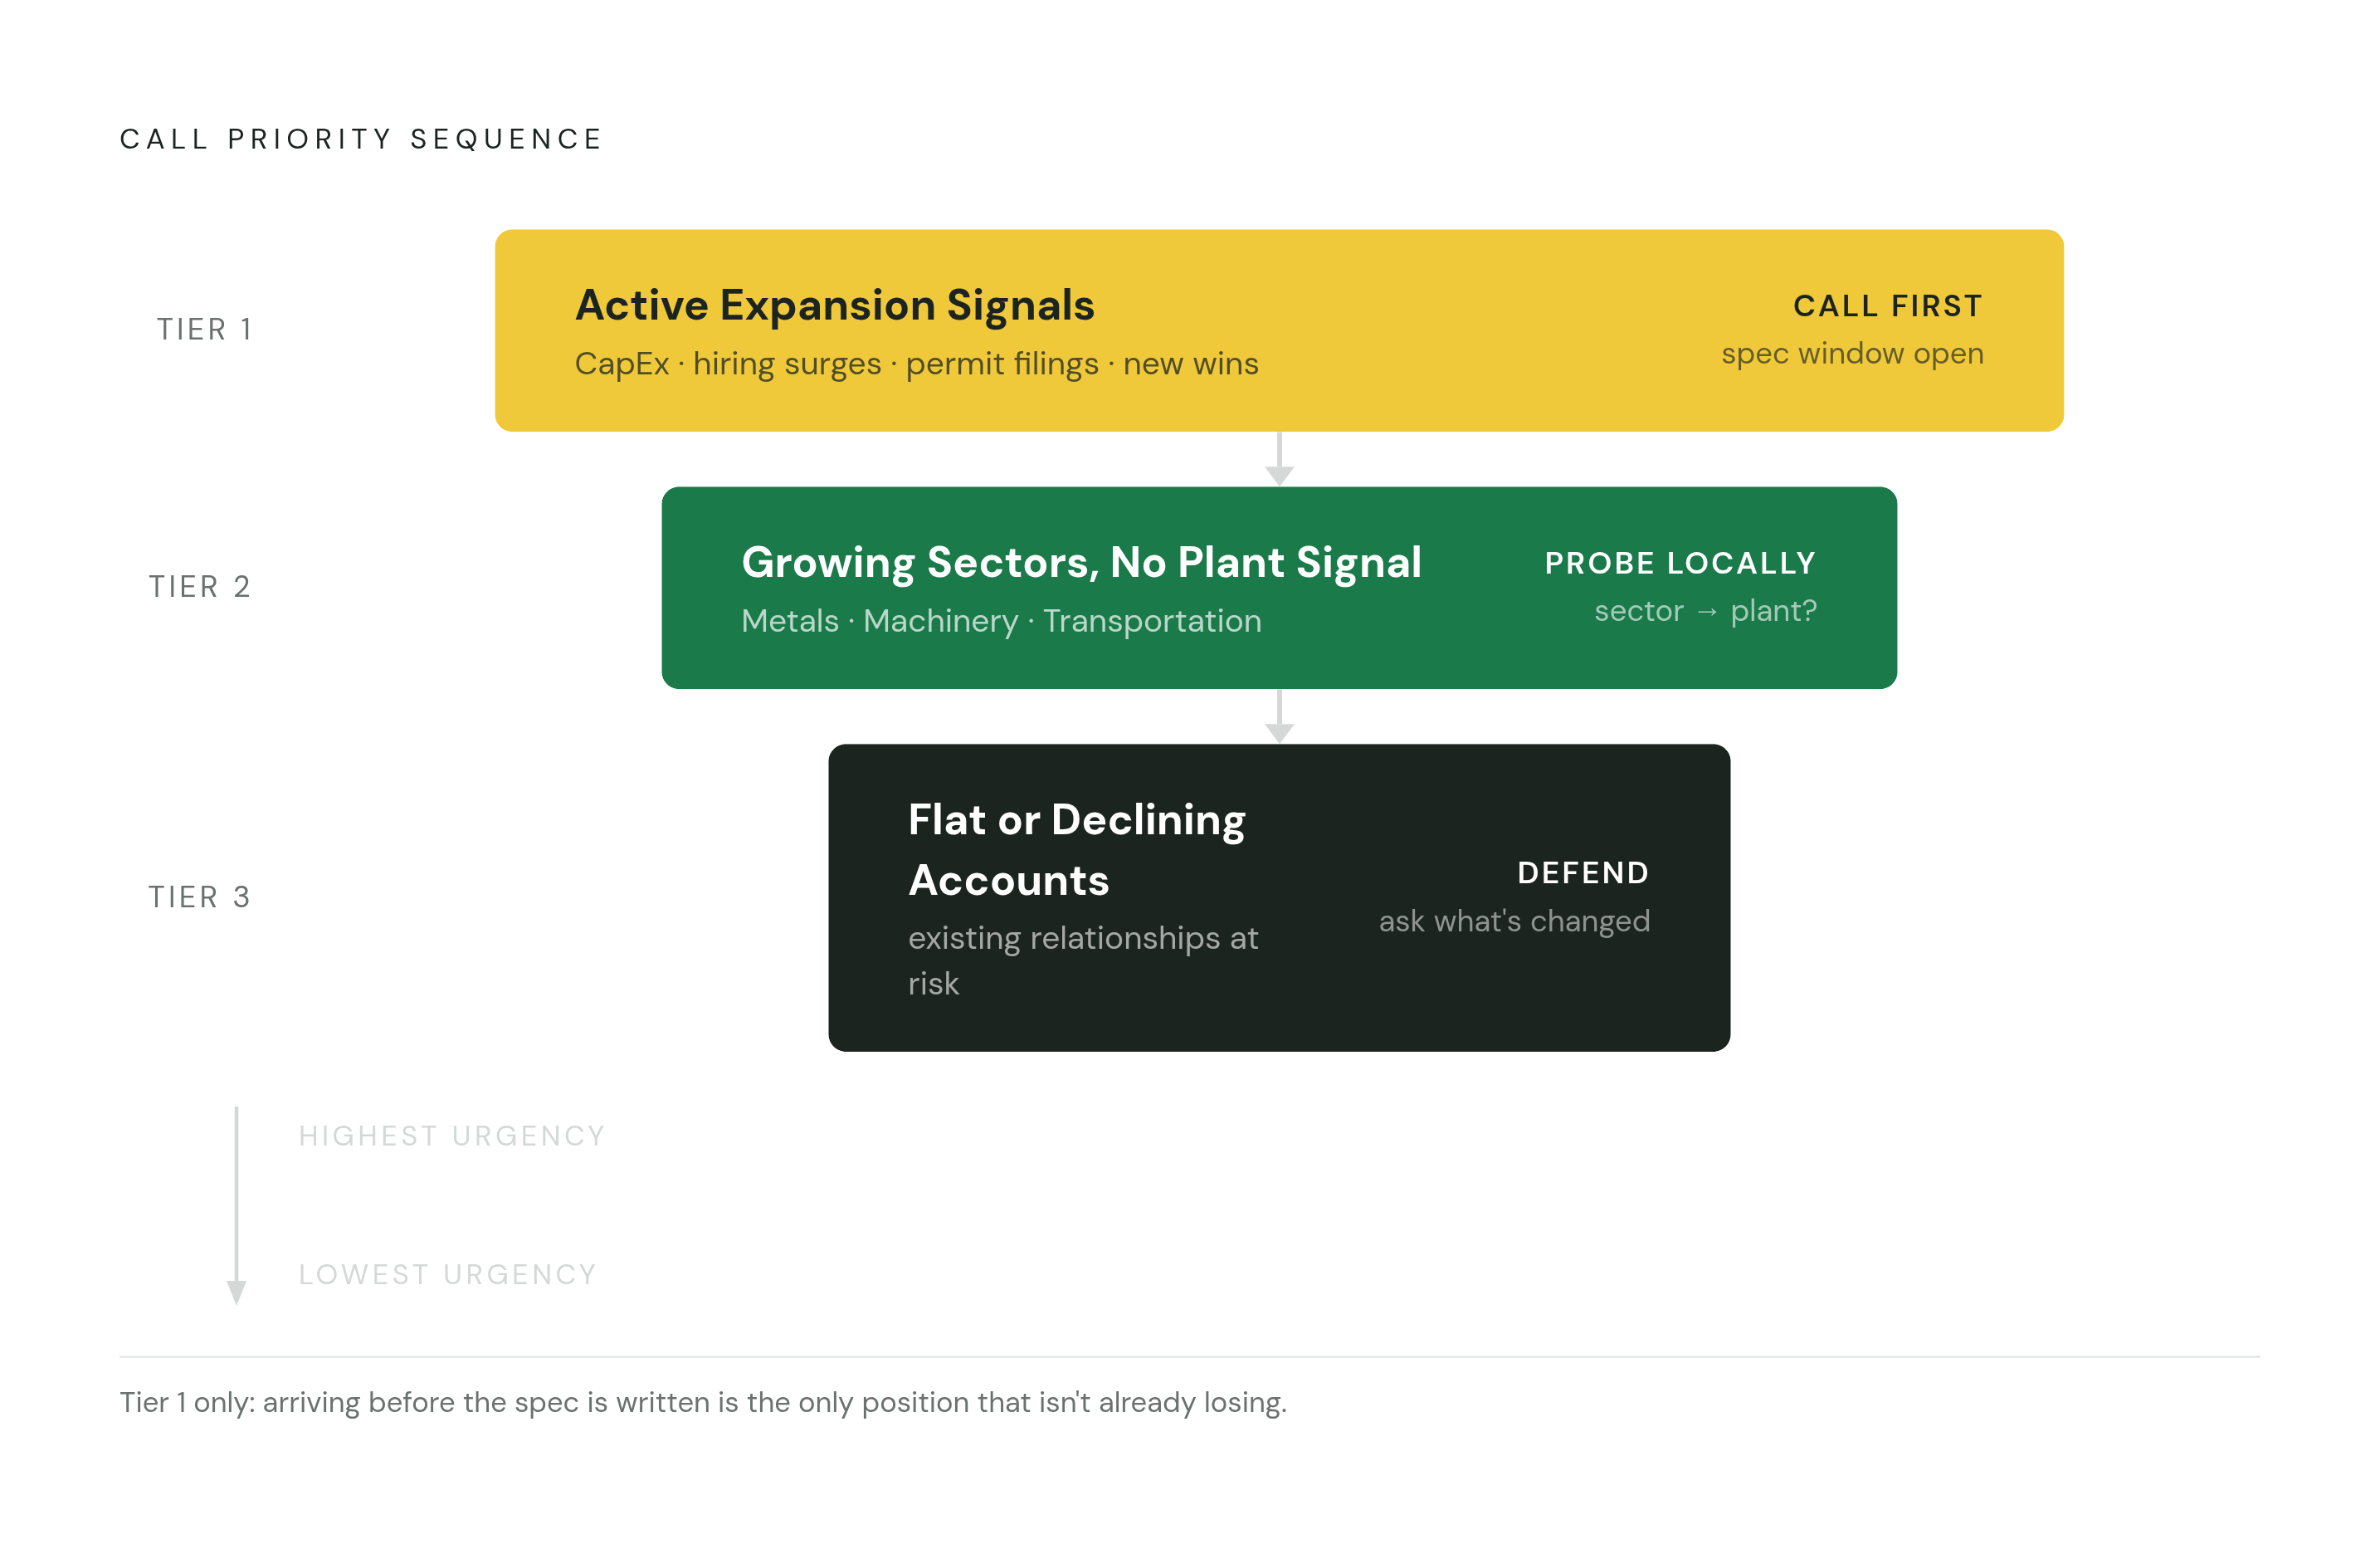
Not every plant in a territory deserves a call this week, and treating them as though they do is exactly how alphabetical account lists and revenue-history rankings waste a rep's time. Signal-based prioritization replaces the static list with something that actually moves as the plants themselves move.
Tier 1 covers plants showing active expansion signals right now: CapEx announcements, hiring surges, new customer wins, permit filings. These carry the highest urgency, sit earliest in the specification window, and tend to be the most receptive to a conversation framed around an actual need instead of a generic pitch.
Tier 2 covers plants sitting in sectors the ISM data shows growing, without a confirmed plant-level signal yet. These deserve a proactive call for one specific reason: to find out whether the sector trend is showing up at that facility or passing it by entirely.
Tier 3 covers existing accounts with flat or declining production indicators. The job here is defense. Protect the relationship, ask direct questions about what's changed, and never assume this quarter's run rate is a repeat of last quarter's, because sometimes it isn't and the account record just hasn't caught up yet.
There's a cross-sell case buried inside existing accounts that order-history reviews miss completely. A plant that's bought soluble oil for general machining for years but recently added a grinding line for aerospace parts is sitting on a synthetic fluid opportunity. A rep who only checks past orders will never see it, because the order history says everything's fine when it isn't anymore.
Territory plans built around actual manufacturing density and production activity beat territory plans built around geography or historical revenue, every time I've seen the two compared. Drive time should follow where production is growing, not where the biggest accounts happen to sit on a map. And because manufacturing sales cycles stretch across many months, the rep who engages right when the signal appears gets the whole cycle to work with. The rep who waits for the RFQ starts at the tail end of somebody else's process, competing on terms somebody else already set.
None of it works, though, if the signal lives in a spreadsheet nobody opens, or a research task a rep is supposed to remember to run before every call. It has to sit inside the CRM he's already using, attached to the account record he's already looking at. Otherwise it won't get checked, not consistently, and not for long.