Free Territory Mapping Tools for Industrial Sales Routes
Plant-level data, not mapping software, determines territory planning success.

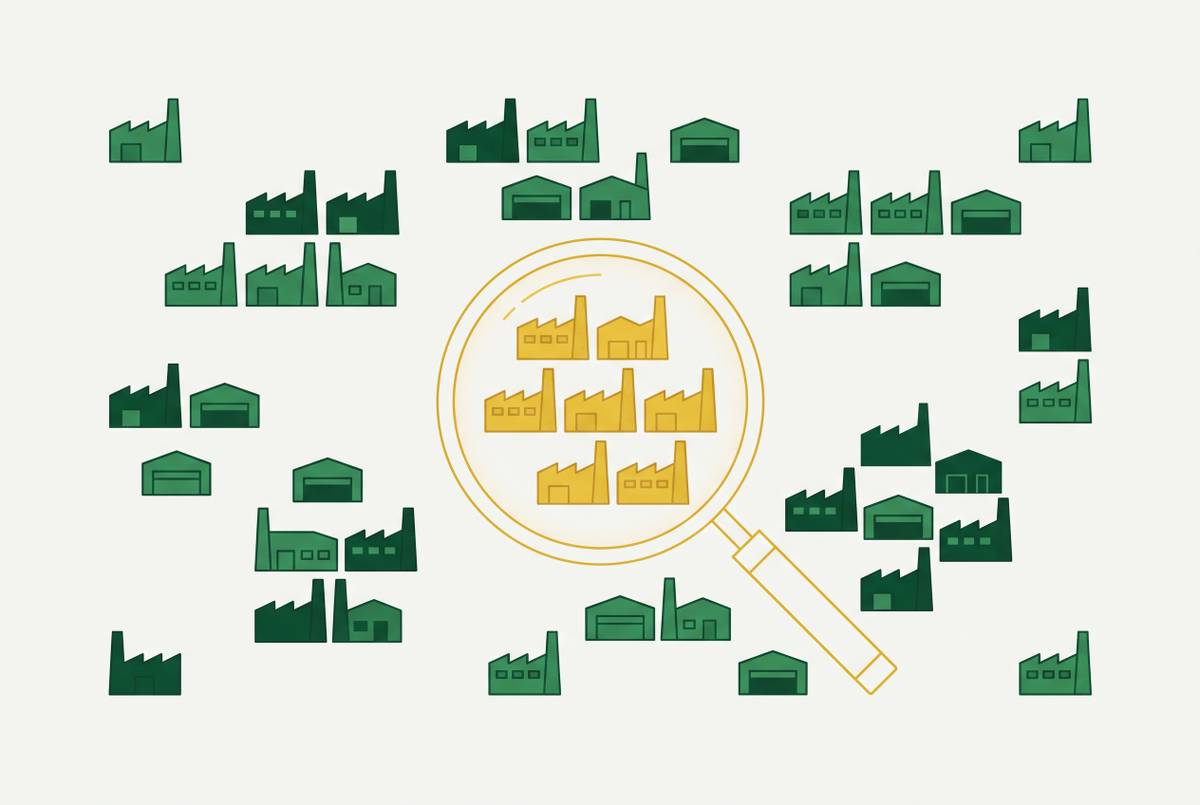
Free territory mapping tools can help with manufacturing sales territory planning when the data they use describes each plant as well as company headquarters. Google My Maps, InstaMaps, and BatchGeo provide the visualization layer, while facility-level intelligence, including Corvus, supplies the production context needed to locate demand. The right sequence is to establish where plants operate and what they need, then choose mapping software for quarterly planning or daily field execution.
What free territory mapping tools actually do — and what they assume about your accounts
A sales manager staring at a spreadsheet of uneven quota attainment cannot easily tell whether the problem is coverage, overlap, or unequal opportunity. Account counts and rep assignments show ownership, but they do not show how accounts cluster. A map makes that distribution visible at no cost. Plotting locations and coloring them by rep or segment can expose gaps that a list view conceals.
Google My Maps works well for one-off maps with fewer than a few hundred addresses, though each layer has a 2,000-row limit. It has no dynamic filtering, so data that changes often is harder to manage. QGIS offers boundary drawing, demographic overlays, and spatial analysis without a license fee. Its constraint is specialist skill rather than cost. It requires GIS training and fits an organization with a dedicated analyst better than a sales manager seeking a quick spreadsheet-to-map workflow.
Regardless of software, a useful territory map needs account locations, rep ownership, distinct territory colors or borders, and a way to share it without full CRM access. Filters by deal stage, revenue, or last activity make reviews more useful, though not every free option provides them. These requirements concern territory mapping, which determines who covers which accounts during a quarterly review, while route optimization sequences today's stops. Free mapping tools generally do not have automatic route sequencing, real-time GPS tracking, or visit logging with CRM sync.
What paid tools add, and when those additions matter
Paid tools are worth their cost when teams need to go beyond mapping who owns accounts to handle daily field execution or more complex territory design. Mobile route optimization, GPS-verified visits, and CRM-synced visit logs help reps who drive between accounts each day. Automated balancing and AI-driven suggestions help with the work of planning territories. Salesforce's official pricing page states that Maps licenses start at $75 per user per month.
The options differ in their intended work. AlignMix has drag-and-drop realignment with live metric updates, account-level mapping, and scenario modeling before changes are made, while eSpatial has algorithmic balancing and side-by-side scenario comparison. Salesforce Maps and EasyTerritory serve Salesforce and Microsoft Dynamics teams respectively, with integration depth as the key distinction. For these buyers, the decision is partly about how territory work fits the CRM.
Free tools can do the basic job for quarterly reviews, but teams that work in different places may need rep assignment automation, commission routing, and order-level permissions. Those are legitimate reasons to pay. Daily mobile routing and GPS-verified tracking are others. However, none of those additions establishes whether an account address represents a real manufacturing buying location. Scale amplifies incorrect inputs as readily as it exposes missing software features, so the harder question is what the system is mapping.
Why the input data — not the mapping tool — determines whether industrial territory plans work
During a territory review, a manager may take similar account counts as a sign that reps have much the same chance to sell. Mapping software uses those records and their owner fields without checking what buying unit they stand for. The resulting balance can be false. If the records omit major plants or duplicate a holding company's headquarters, the map faithfully displays the wrong market. Changing the boundary cannot recover demand that is absent from the account universe.
An illustrative pump manufacturer example shows the mechanism. A global manufacturer might appear in the CRM as one account in a single city, even though its operating plants span several states. Plant-level enrichment would turn that one entry into a record for each facility across those states. This illustrates a common structural pattern. Its significance is that the territory review changes before any boundary moves, because the manager is finally assigning the locations where production occurs.
Outdated or incomplete contact records compound the problem, but freshness alone does not solve it. Many manufacturers have a minimal content footprint and do not publish buying signals through B2B publisher networks as software companies do. Web-based enrichment can thus leave manufacturing records with few details even when a company address is up to date. Corvus indexes manufacturing plants directly rather than relying on generic company records, addressing that distinction at the source. The necessary correction is not simply a newer export, but an account model that separates holding companies, distribution centers, and operating plants.
How manufacturing territory logic differs from standard B2B account mapping
For industrial field sales, the plant is the buying unit. A standard company record with a headquarters or billing address and one owner can suit many B2B sales models. A manufacturer, however, may operate facilities across multiple states, each with its own plant manager, production lines, equipment, budget authority, and purchasing cycle. One company pin can conceal most of those buying locations. Some may belong in a different rep's geography from the headquarters account.
Separating facilities is not merely an address correction. Two plants under the same parent may make different products, use different equipment, and need different supplies. Treating them as duplicates erases the distinctions that qualify an opportunity. Shift patterns deepen that difference because a three-shift plant consumes fluids, consumables, and services at a different rate from a one-shift operation. Company revenue and headcount cannot establish that operating intensity on their own.
For metalworking fluid sellers, automotive plant concentration is particularly relevant because automotive manufacturing accounts for a substantial share of demand. A headquarters map does not reveal that concentration. Nor does a generic SIC or NAICS classification, paired with employee count, explain what a plant machines, which equipment it runs, or how many shifts it operates. Those details help show how much a facility is likely to use. Without them, a map can look complete while leaving the commercial structure of the territory largely invisible.
What plant-level signals actually tell a rep about demand before a call is made
A plant's production process identifies the category of need. Machining aluminum aerospace components creates a different fluid, coating, and chemical purchasing profile from stamping steel automotive body panels, even where broad industry classifications overlap. For a metalworking fluid rep, a useful record describes the work a plant does as well as its industry label. That distinction also transfers to specialty chemicals, coatings, and water treatment. The relevant demand starts with the facility's operation.
Equipment and shift count make that production profile more specific. CNC machining centers run at higher speeds and tighter tolerances than older platforms, changing fluid specification requirements. Knowing the equipment helps a rep find a product that fits before the first conversation. Shift count then indicates operating intensity. A plant running three shifts has faster fluid consumption, more frequent service needs, and greater urgency around supply reliability than a one-shift operation in the same building.
Expansion announcements, new production lines, and CapEx budget increases can be supported by SEC filings, earnings transcripts, and press releases. These signals indicate that a facility is entering a qualification cycle for products and suppliers. Multiple signals sharpen the reason for outreach. A new facility, hiring for automation roles, and announced CapEx together provide a stronger basis for engagement than any one signal alone.
This evidence is different from generic intent data based on what people read across publisher networks. Manufacturing accounts rarely show what they need to buy through those networks, so facts about their plants and how they run are more useful. A CRM history shows products already sold, while a full production footprint identifies other lines, processes, fluids, and chemicals in use. The gap between those views is potential demand that transaction-based territory records do not show.
How to build an industrial territory plan that reflects manufacturing density, not just geography
A sales operations leader can apply this logic by first building the account universe at facility level. Every plant needs its own address, production profile, and rep assignment, even when the plants have the same parent company. This establishes the unit that will be mapped. For the intelligence layer, an option such as Corvus supplies plant-level production context rather than asking a visualization tool to infer it from company records. The mapping layer can then display a market grounded in actual operating locations.
The next step is to weight territories by demand potential. Five large, three-shift automotive machining plants are not equivalent to fifteen small job shops. Plant-level consumption potential provides a more commercially relevant basis for balancing workloads and opportunity. Geography remains part of the plan, but it is not the sole organizing rule. Otherwise, territories that look alike may have very different levels of product demand.
Process-type clustering follows that weighting exercise. Reps whose expertise or product lines focus on grinding, turning, stamping, or forming should cover concentrations of those processes, rather than groups formed only by geographic adjacency. This connects assignment to product fit. Recent expansion announcements, equipment purchases, and leadership changes can then establish priorities within each assigned territory. A facility with a relevant activity signal has a clearer reason for outreach than a comparable plant with no recent signal.
The plan also needs a quarterly review against actual manufacturing density alongside its annual redraw. Plants open, close, expand, and retool, so an allocation that was balanced six months ago may leave a new concentration underserved. Free tools such as InstaMaps can visualize and share the corrected, weighted account universe throughout that review process. Their role remains the display layer. The practical output is a ranked call list in which each rep knows the owned facilities, what they make, what they likely need, and which show signs of readiness to buy.
What to expect from free tools once the data underneath them is right
With facility records in place, the manager reviewing uneven quota attainment has a more useful basis for comparison. When account totals look alike, the manager can check production processes, shift patterns, and plant concentration to see whether reps have the same chance to sell. Missing facilities become an identifiable account-coverage issue. The map now supports a substantive territory discussion. It now reveals the demand structure behind headquarters pins.
InstaMaps, Google My Maps, and BatchGeo can provide clear, shareable visualizations at zero cost, which is sufficient for quarterly reviews by most smaller teams. Their value depends on the job assigned to them. They can show corrected territory ownership without also supplying production intelligence or daily field execution. In that setting, a facility-based map is a stronger planning foundation than a paid platform displaying only company-level addresses. A higher software budget does not compensate for missing buying locations.
Distinguishing an execution shortfall from an information shortfall is necessary before upgrading. Daily mobile routing, GPS-verified visits, and automated commission assignment need tools that do more than free mapping, however good the records are. Territories that look balanced while reps struggle to find demand instead call for scrutiny of the account universe and its production detail. Knowing what plants make and what their operations require changes the plan more fundamentally than changing its visual presentation. Establish that data layer first, then select the mapping tool that fits the team's field execution needs.