Territory Coverage in States With Dispersed Manufacturing Populations
Plant-level signals matter more than geography when mapping dispersed manufacturing territory.
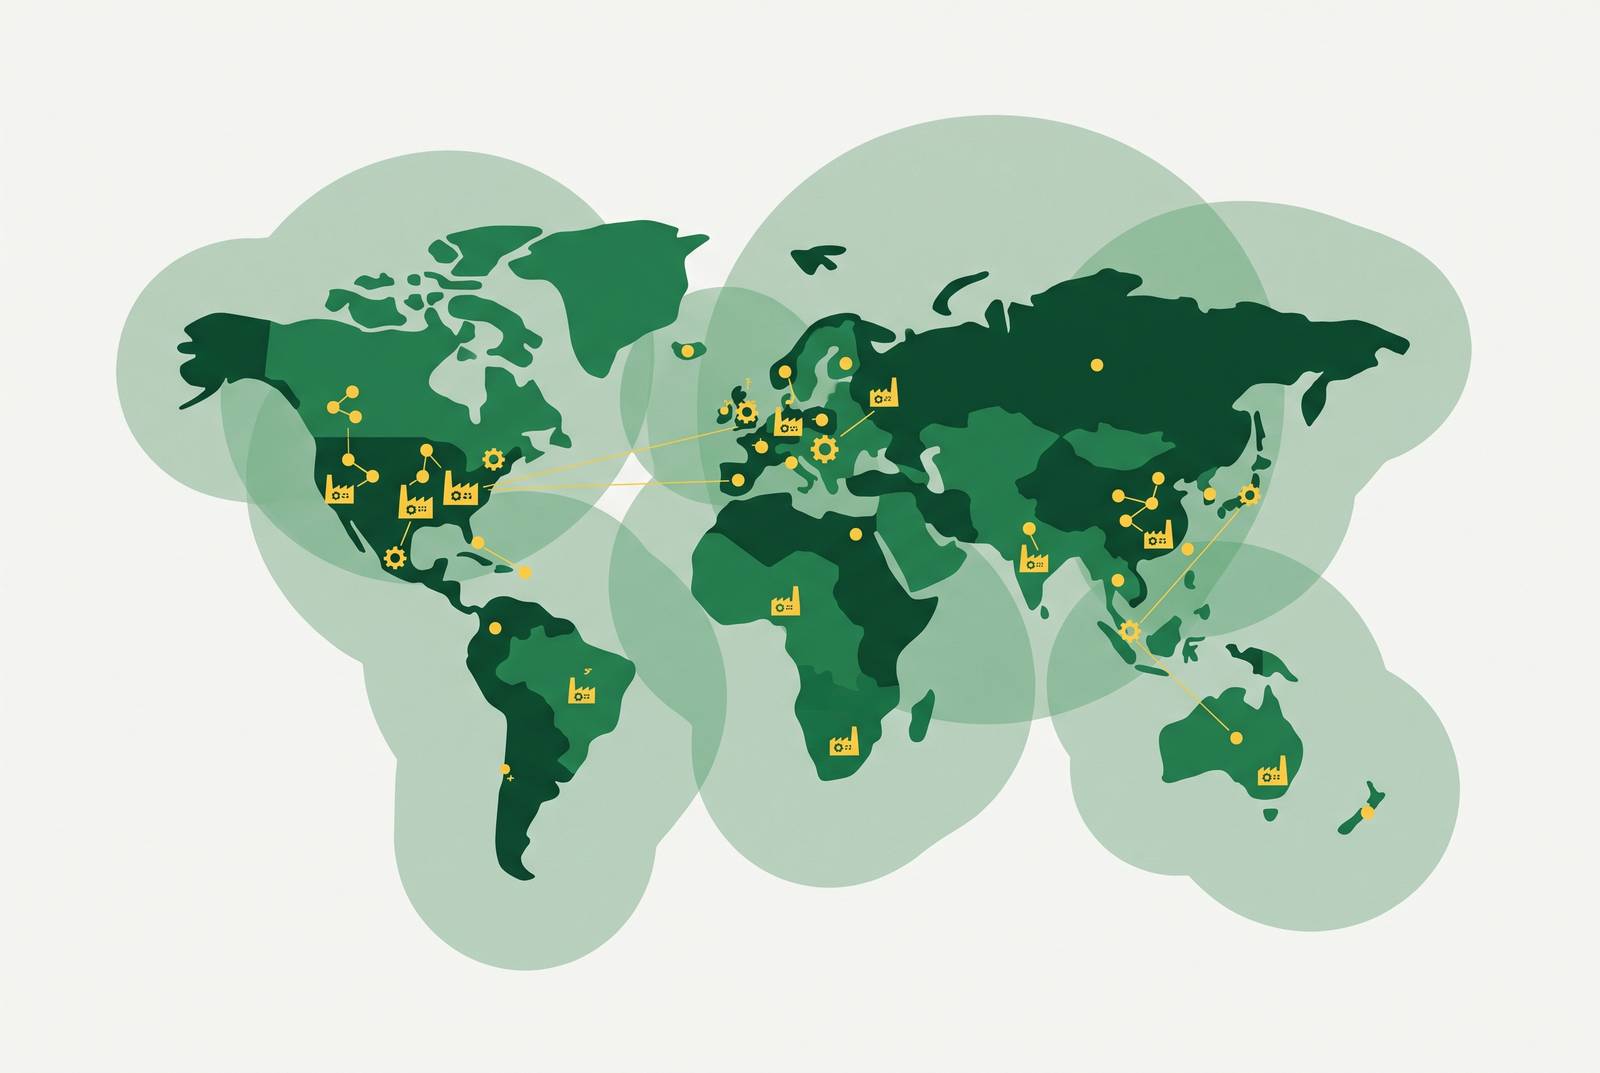
Manufacturing in the country doesn't sit where most sales teams think it sits. Territory maps built on population centers and radius lines work fine in Ohio or Pennsylvania, where plants cluster near the same metro corridors as everyone else. In Iowa, Mississippi, and Montana, that same map is wrong, and the accounts a rep actually needs to see are scattered across counties nobody bothered to circle.
How manufacturing across the country manufacturing is distributed, and why the map surprises most sales teams
The South holds about 32% of the country's manufacturing establishments and the Midwest close to 30%, but those numbers count locations, not output. A state can carry a huge share of establishments and still trail badly on production volume, because establishment count and plant scale move independently of each other.
California leads the country with roughly 35,936 manufacturing establishments, more than any other state, though a lot of that count skews toward smaller shops rather than big continuous-process sites. Texas comes in second with about 20,781. Compare that to Indiana, Kentucky, and Mississippi: far fewer locations on paper, but the average plant runs much bigger. A rep selling by volume, tank size, or throughput needs to know that difference before drawing a single boundary line, because a state with fewer dots on the map can still hold more revenue per dot.
That split produces three different ways to carve a territory, and they don't overlap much. Some states reward chasing breadth of prospect count: California, Texas, Florida, New York, Ohio, Pennsylvania. Others reward chasing individual plant size: Mississippi, Kentucky, Indiana, Iowa, Alabama, South Carolina. A third group clusters around advanced manufacturing profiles: California, Massachusetts, Connecticut, Washington, Arizona, Maryland. A territory plan that treats all three the same way is guessing.
One more fact changes how much coverage investment makes sense here. The average manufacturer in the country manufacturer has operated for more than 47 years, and over 88% have been in business more than two decades. These are long relationships built on trust with whoever shows up consistently, not accounts that vanish or churn. They're long relationships built on trust with whoever shows up consistently. The cost of getting a territory plan wrong compounds for years, not quarters.
Dispersed-state coverage versus ordinary rural sales challenges
In a dense corridor like metro Ohio or the Chicago suburbs, a rep can cover 80 accounts pretty badly and still bump into enough live buyers by accident to hit quota. Proximity does the work that planning should be doing. Dispersed states remove that safety net entirely, because there's no accidental density to fall back on.
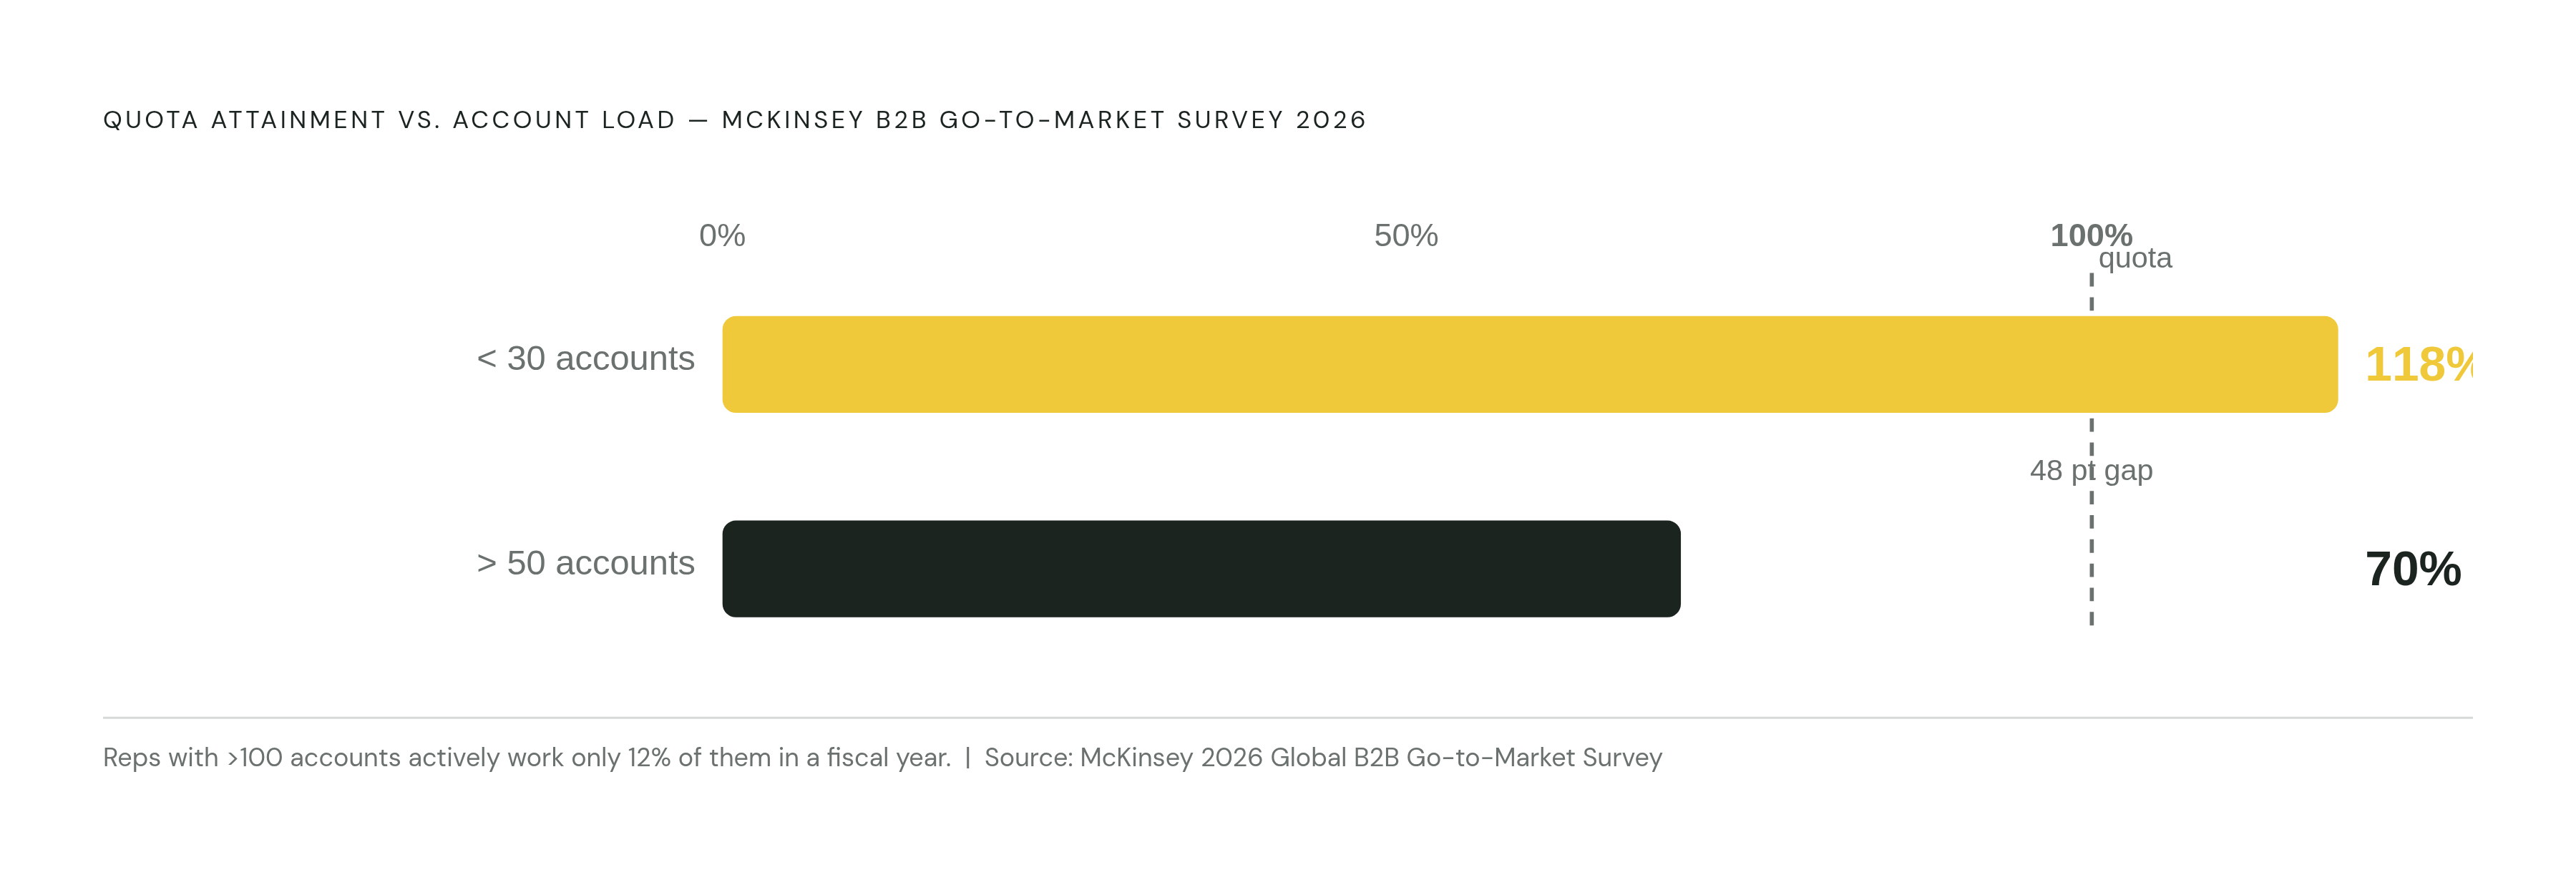
Account overload is the deeper structural problem, occurring across all territories, not just rural ones. Account executives handed more than 100 accounts actively work only about 12% of them in a given fiscal year, leaving the rest untouched. That's a book stuffed with names nobody touches.
In a dispersed state, that 12% problem gets worse, not better. Geographic friction means even the accounts a rep supposedly "owns" can go months without a real conversation, simply because the drive isn't worth it on a given week. McKinsey's 2026 Global B2B Go-to-Market Survey found enterprise reps managing fewer than 30 named accounts hit 118% of quota, while reps carrying more than 50 accounts struggled to clear 70% attainment. The data points one direction: smaller, sharper books beat bloated ones, especially once travel time enters the equation.
Geography and NAICS codes produce false pictures of where the real accounts are
Drawing a grid over a map and assuming opportunity density tracks physical proximity works fine for software sales. It falls apart in manufacturing, where two plants ten miles apart can run completely different processes at completely different scales.
NAICS codes make the problem worse. Codes 31 through 33 cover food and beverage, textiles, chemicals, plastics, metals, machinery, electronics, transportation equipment, furniture, and a catch-all "miscellaneous" bucket. A single code can describe a small job shop and a continuous-process plant many times its size sitting in the same county, with nothing in the database to tell them apart. A rep pulling a list by NAICS code alone has no idea which name on the page is worth a two-hour drive and which one is a distraction.
Generic B2B databases built for SaaS and tech don't track the things that actually matter here: facility expansions, automation investment, reshoring announcements, supply chain shifts. Those are the real buying-intent signals in industrial markets, and a firmographic record built around headcount and revenue band omits them. The plant-level data that would feed any smarter system sits fragmented across NAICS lookups, state directories, SEC filings, and trade press, not in one clean feed anyone can just pull.
Plant-level data reshapes territory design in low-density manufacturing states
Getting territory design right in a dispersed state means stacking three layers of data on top of each other, not picking one and hoping it's enough.
The first layer is internal: CRM win rates by segment and vertical, average contract value, sales cycle length, and rep performance history. The second is geospatial: where current customers and ICP-fit targets physically sit, and density metrics that tell a field team how to spend drive time. The third is third-party market data: firmographics, intent signals, and competitive presence by region.
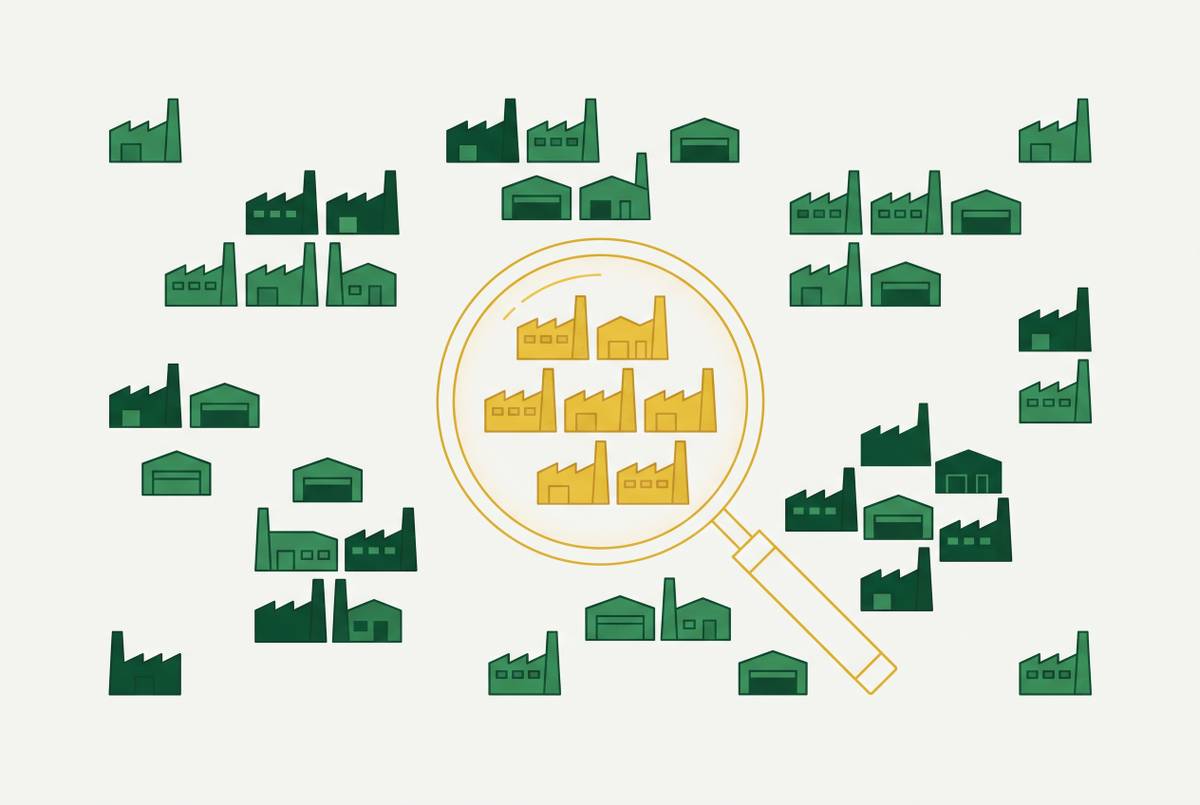
For manufacturing, that third layer has to go past the firmographic surface and down to the plant itself. What does the facility make? What process equipment does it run? What does its production volume say about consumable demand, whether that's coolant, cleaning chemistry, or replacement parts?
A handful of plant-level signals should move accounts up or down a prioritization list. Facility expansion announcements mean active capex, and active capex means vendor decisions are open. Automation and robotics investment often signals new fluid, chemical, or coating requirements tied to the new equipment. Environmental permit filings raise compliance-driven purchasing that wasn't there before. Leadership changes matter too, since a new plant manager or procurement lead resets vendor relationships that looked stable a month earlier. Post-merger integration deserves its own line: industrial M&A ran at $173 billion over the past year, and acquiring companies routinely revisit vendor standardization across the combined operation.
None of these signals means much alone. A plant showing facility expansion, automation investment, and a leadership change all at once is a materially different priority than a plant showing just one of those. In a market where every visit costs real drive time, that clustering is the territory plan, not a footnote to it.
Routing and call-frequency logic once the real plant map is visible
Once the real plants are mapped, accurately, by what they make and what they're doing right now, routing stops being a guess about which ZIP codes probably matter. It becomes an optimization problem with real stops on the board.
Vertical-specific territory design beats pure geographic carving in manufacturing, and the reason is straightforward: buyers expect a rep to already understand their compliance requirements and operational constraints. Domain depth shortens the sales cycle faster than geographic breadth ever will, because the rep isn't spending the first three meetings learning the plant's process.
The routing logic that follows is fairly mechanical once the map is right. Cluster ICP-fit plants by drive time, not by county line, since a 90-minute loop through three counties hitting five high-signal plants beats a 30-minute trip to one marginal account. Tier accounts by signal strength and production scale, then set call frequency off that tier: Tier A, high signal and large plant, gets quarterly face time, while Tier C, low signal and small plant, gets digital nurture until something fires. Reserve field capacity for Tier A and B. White-space accounts only enter the route once a trigger event, an expansion permit, a leadership change, pushes their signal score up.
Territory drift is a real risk here, and it's not hypothetical. Reshoring investment is currently landing in 42 states. A territory map drawn 18 months ago may already be missing plants that didn't exist when it was built.
Growing existing accounts across dispersed geographies, the multi-site expansion opportunity
The math favors the accounts already on the books. Selling to an existing customer runs a 60 to 70% success rate, against 5 to 20% for a brand-new prospect, and cross-sell and upsell together make up roughly 35% of total B2B revenue. In a dispersed state, where every new-logo visit costs hours of driving, that arithmetic matters even more than it does elsewhere.
In chemicals and fluids, the expansion path is concrete and specific. Win one chemistry SKU at one process step, coolant on a CNC line, say, and the door opens to rust inhibitors, cleaners, and floor care across the rest of the facility. The plant's full process map sets the ceiling on how far that expansion can go, and that ceiling is different for every plant.
Multi-site manufacturers deserve the most attention in a dispersed territory, because the leverage compounds. Win one plant, prove the value there, and the conversation with corporate procurement about standardizing across sister facilities becomes real. Plant-level data shows exactly which sister facilities run the same processes and equipment, making the expansion pitch specific to that plant. It's built around what that specific sister plant actually makes.
Timing that expansion off signals beats timing it off the calendar. The triggers that matter, new production lines, new capital equipment installs, hiring in operations roles, new permits, tell a rep when the account is actually ready to talk. A scheduled quarterly check-in tells them nothing.
A well-designed territory model in a dispersed manufacturing state
Start at the facility level, not the company level. What does the plant make, what processes does it run, and what does that say about what it's likely to buy? That's the real account segmentation, and it makes everything downstream in a manufacturing territory actually mean something.
From there, split facilities into tiers before drawing a single geographic line. Tier A criteria: ICP-fit, high production volume, multiple active signals, and either a prior relationship or a clear shot at displacing a competitor. Tier B: ICP-fit with moderate signal, expecting a longer cycle. Tier C: marginal fit or no current signal, worth monitoring but not worth routing a visit around yet.
Rep capacity needs the same honesty. Measure against fully ramped selling capacity, not planned headcount, accounting for ramp time (roughly 4 to 6 months for mid-market reps, 9 to 12 months for enterprise) and for attrition. Mapping territory to planned capacity instead of actual capacity leaves chunks of a state unworked, and competitors fill those gaps quietly, without anyone noticing until the next quota cycle.
Quota and compensation have to connect to the territory design from day one, not get bolted on afterward. Reps stuck in over-quota, under-potential territories disengage. Reps sitting in under-quota, high-potential territories coast. In a dispersed state, where opportunity swings hard from one county to the next, that alignment is essential. A territory plan that gets worked looks different from one that just gets drawn.