Pipeline Generation Metrics for Industrial Sales Teams
Qualified pipeline in manufacturing sales requires plant-level fit, not just meetings.

Pipeline generation means qualified opportunities that have a dollar value, a stage, and a next step. It does not mean contacts, meetings, or form fills, and a meeting that hasn't cleared a written qualification bar is not pipeline yet. For a sales team selling into manufacturing, a forecast built on that distinction holds up, and a forecast built without it collapses mid-quarter. The inputs that make a manufacturing opportunity real, the right plant, the right process fit, the right people in the buying committee, require plant-level knowledge that most CRM records simply don't carry.
Manufacturing buying committees routinely span four functions: operations, engineering, procurement, and finance. Reaching one of those four is not enough to call a deal in motion, yet a "meeting booked" metric rarely distinguishes who sat in the room. That omission produces a comforting number that hides a targeting failure: the meeting happened, the activity log shows green, and the deal still has no path to a signature because engineering was never in the conversation. Plant managers, production supervisors, and operations directors spend much of their day on the floor rather than at a desk, and they are harder to reach by email than office-based buyers in most other industries. Outreach volume, the oldest and most trusted proxy metric in B2B sales, is especially unreliable here, because it measures effort against a population that doesn't respond the way the benchmark assumes it will.
The four metrics that predict revenue in manufacturing sales
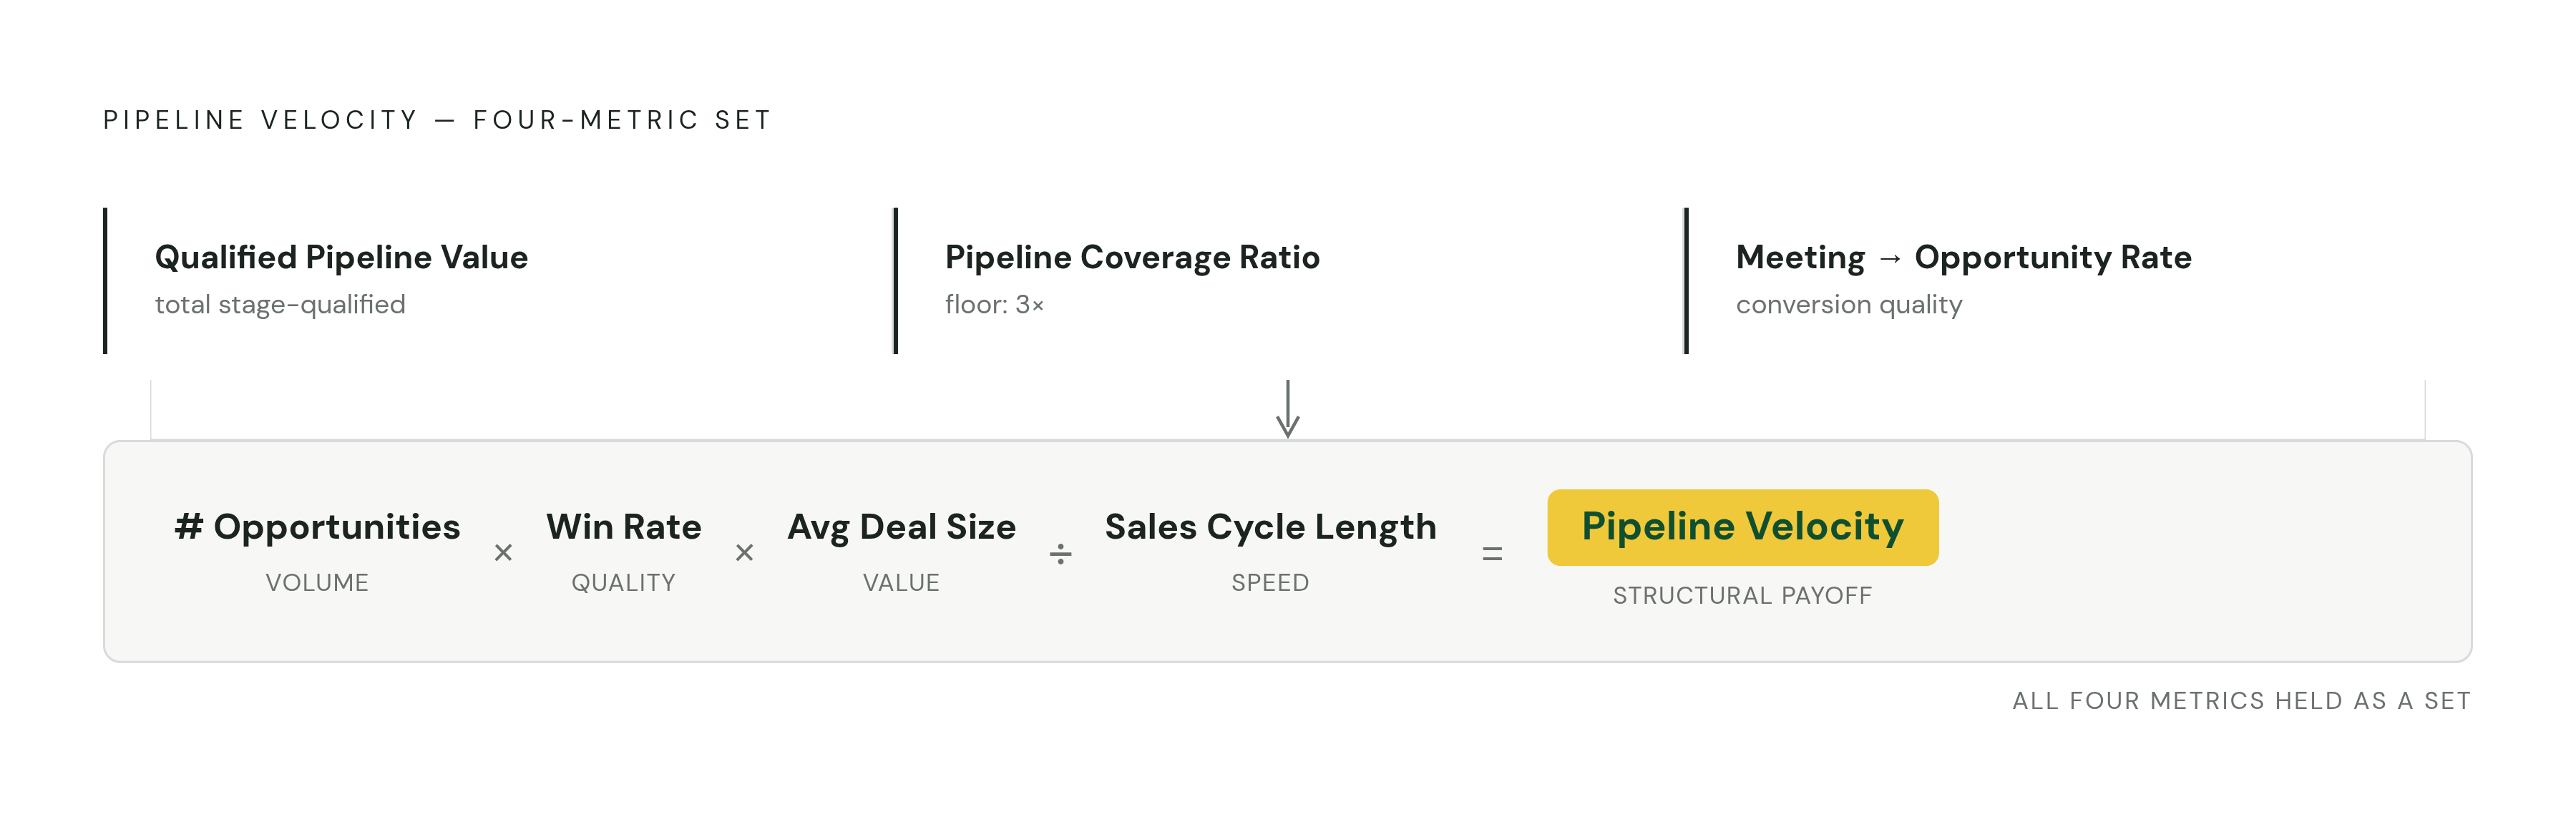
Four metrics predict future revenue. Everything else, every dashboard tile measuring calls made, emails sent, or meetings logged, functions at best as a leading indicator and at worst as a vanity metric dressed up as progress. The four are qualified pipeline value, pipeline coverage ratio, meeting-to-opportunity conversion rate, and pipeline velocity, and they are meant to be held together as a set rather than optimized one at a time.
Qualified pipeline value is the sum of open opportunities that have cleared a written qualification bar, not every deal sitting in the CRM and not every meeting sitting on a calendar. Unqualified deals padding the pipeline are a leading reason forecasts miss: the total looks healthy right up until the quarter closes and the number isn't there. In manufacturing accounts, the qualification bar has to include plant-level fit: what the facility actually makes, what equipment it runs, and whether the production volume justifies pursuing the account, going beyond a title match paired with a booked calendar slot.
Pipeline coverage ratio divides open qualified pipeline by quota for the period. The standard planning convention treats three-times coverage as a floor, but that number means little if you don't account for cycle length. Manufacturing sales cycles run longer than those in most sectors, so a coverage ratio has to be read against how long deals actually take to close, or it will systematically overstate what the current quarter is going to produce. The right coverage target is specific to each business: it's the ratio that has historically converted to quota for that team, drawn from the team's own results rather than a benchmark copied out of a SaaS industry report.
Meeting-to-opportunity conversion rate divides opportunities created by qualified meetings held. High meeting volume paired with low conversion exposes a targeting problem rather than a closing problem, and it appears earlier in the data than any other metric in the set. A sales leader watching this rate drop has the earliest diagnostic signal available that ICP definition or territory targeting needs adjustment, with enough runway left to fix it before the quarter is lost.
Pipeline velocity compresses volume, quality, and speed into a single figure: the number of opportunities, multiplied by win rate, multiplied by average deal size, divided by sales cycle length. The gap between top and bottom performers on this metric is structural. It reflects compounding advantages across all four inputs at once; it's not just one team working harder or calling more prospects. Falling velocity alongside stable volume is a diagnostic signal that qualification or deal progression has broken down, not that sourcing has dried up, and adding headcount to generate more pipeline in response may solve a problem the team doesn't actually have.
Why manufacturing sales cycles break these benchmarks
Every benchmark attached to these four metrics, the coverage ratio floor, the velocity targets, the conversion rate a VP expects to see, was calibrated on buying behavior that doesn't describe how manufacturers actually buy. Applying those benchmarks to an industrial pipeline without adjustment produces a forecast that is systematically optimistic, not occasionally wrong but wrong in the same direction every quarter.
Win rates have compressed across B2B generally over the past several years. If a pipeline model is still calibrated to 2021 or 2022 win rates, it overestimates what current pipeline will actually produce, and industrial teams running static coverage targets set before market conditions shifted are building their forecast on an assumption that no longer holds. The three-times coverage floor worked when win rates were higher, but now it understates the pipeline you need to hit the same number.
The benchmark that matters is the one a team builds from its own history: the close rate it has actually achieved against qualified pipeline. Cycle length, average deal size, and win rate all have to reflect manufacturing deal reality specifically, because a benchmark imported from faster-cycle, single-stakeholder B2B selling will consistently point the team toward the wrong coverage number. Getting that calibration right requires more than a spreadsheet adjustment. It requires a data foundation detailed enough to tell a rep which accounts in the pipeline are real before the forecast is built on top of them, which is the problem the next two sections take up directly.
How plant-level qualification changes what counts as a qualified opportunity
An opportunity in manufacturing sales isn't qualified until it reflects what the plant actually makes, what processes it runs, and what that production reality implies it needs. A title match paired with stated interest doesn't clear that bar, no matter how clean the CRM record looks. Generic B2B qualification frameworks weren't built to catch this gap. BANT asks about budget, authority, need, and timeline. MEDDIC asks about metrics, economic buyer, decision criteria, decision process, identifying pain, and a champion. Neither asks which production process is actually creating the purchasing need, whether the facility runs the equipment a product is designed to work with, or what production volume would make the account commercially viable.
Thin qualification has a specific consequence: pipeline value that looks healthy in the CRM while representing facilities that don't run the process the product serves. That leaves you with coverage ratios and velocity calculations built on denominator inputs that are fictional, numbers that are internally consistent but externally wrong. Standard intent data makes the problem worse rather than better, because manufacturing buyers don't research purchases the way the intent-data industry assumes most B2B buyers do. They attend trade shows, call peers, and request spec sheets directly, so they skip the blog content and gated whitepapers that behavioral intent platforms are built to track. An opportunity sourced from those content-consumption signals carries less evidentiary weight than one sourced from a facility-level production signal, because the former measures curiosity and the latter measures capacity.
Event-based signals tied to facility reality carry more weight: a new production line coming online, a CapEx increase visible in public filings, a facility permit filed with a local authority, a leadership change announced at the plant level. These are more reliable indicators of genuine buying readiness in industrial verticals than anything derived from content consumption. Qualification criteria for manufacturing accounts should be written around three questions: does this plant run the process the product serves, is its production scale large enough to justify the commercial relationship, and what specifically triggered the opportunity, a facility event grounded in reality or a form fill that measures nothing more than a visitor's curiosity.
Static territory design and its effect on pipeline coverage in manufacturing markets
A coverage ratio calculated against a misaligned territory produces a figure that is mathematically accurate against quota and misleading about the actual market opportunity sitting in front of the rep. A rep can post a healthy coverage ratio while an entire concentration of qualified facilities nearby goes completely unworked, simply because no one drew the territory map with that concentration in mind.
Territory design built around geography, by region, by state, by dealer network, distributes reps relative to map lines rather than relative to where qualified manufacturing accounts actually cluster. Some reps end up carrying more opportunity than they can work while others get a region with too little qualified density to hit quota, and that imbalance shows up on the dashboard as uneven pipeline coverage across the team, but it is actually a territory design failure masquerading as a performance gap.
The coverage ratio means what it claims to mean only when the denominator, the total qualified opportunity available in a given territory, is sized correctly. Territory coverage ratio, the share of the addressable manufacturing base in a territory that has actually been worked, is the metric that surfaces this problem. Tracking what percentage of assigned accounts have been contacted reveals white space, underserved plant concentrations, and reps who've been handed more geography than they can realistically cover. The fix is to treat territory design as a continuous exercise calibrated to actual manufacturing density, where qualified facilities operate, what they produce, and what that signals about commercial potential, rather than a one-time administrative map drawn at the start of the fiscal year and left untouched.
The data substrate that makes manufacturing pipeline metrics honest
Every metric in this framework, qualified pipeline value, coverage ratio, meeting-to-opportunity conversion, velocity, is only as accurate as the data behind it, the data that sets whether an account is genuinely qualified and whether a territory's opportunity has been sized correctly. Get that data wrong and all four metrics inherit the error, no matter how carefully the formulas are applied.
NAICS codes and employee headcounts, the standard substrate most sales teams build their account universe on, classify establishments by industry category rather than by what a specific facility actually makes, what processes it runs, what equipment it operates, or what production volume it sustains. Two plants carrying identical NAICS codes can have completely different purchasing needs, and a territory or qualification model built on that classification alone will treat them as interchangeable when they aren't. Plant-level production data closes that gap directly. Knowing what a facility makes and what equipment it runs lets a rep determine, before the first call, whether that facility is even a plausible buyer, which turns the meeting-to-opportunity conversion rate from a lagging measure of how good targeting turned out to be into something a team can improve before the meetings ever get booked.
The CRM itself is an underused signal asset in most industrial sales organizations. ERP and CRM records already hold account-level purchase history, service intervals, and product usage data, but most teams never surface it systematically. Matched against a full plant-level profile of an account, that internal data reveals cross-sell and upsell white space that a quarterly territory review, working from maps and quotas alone, will never find. A CRM fed with facility-level production intelligence, what a plant makes, what equipment it runs, what its production footprint looks like, produces coverage ratios, velocity calculations, and conversion rates that describe manufacturing reality rather than approximate it through firmographic proxies built for a different kind of buyer.
Running a weekly pipeline review that catches problems in manufacturing accounts
High-performing teams run this review weekly, catching a miss while there is still time to fix it before the quarter is lost. A weekly review built for manufacturing accounts needs to answer the same four questions every time it convenes. It has to establish whether the team has enough qualified pipeline, measured as a coverage ratio calculated on qualified-only opportunities, to hit the number given the team's actual historical win rate and cycle length, rather than a borrowed benchmark. It has to check whether meetings are converting to qualified opportunities at an acceptable rate, and if they aren't, whether the failure sits at the targeting stage, wrong plants being called on in the first place, or at the qualification stage, right plants but wrong timing. It has to identify which opportunities have stalled, and at which stage of the buying committee, operations, engineering, procurement, or finance, each stall is happening, along with the next concrete action that would move it forward. And it has to track whether velocity is rising or falling relative to the prior period, and if it's falling, whether the cause is sourcing volume, win rate, deal size, or a cycle length that's quietly stretching out.
Falling velocity paired with stable volume is the signal most commonly misread as a sourcing shortfall, prompting a team to respond by adding outbound activity when the real diagnostic lies in stage-conversion rates, which will show exactly where in the buying committee deals are getting stuck. Pipeline hygiene, removing stale opportunities and applying honest stage probabilities before calculating coverage, is the mechanism that keeps the coverage ratio from turning into a comfortable fiction the team tells itself every Monday morning, not administrative housekeeping to get to when time allows. For manufacturing accounts specifically, a stalled opportunity often reflects a committee-stage problem rather than a dead deal: the operations contact is still engaged and responsive, but engineering validation hasn't moved in three weeks. Tracking which stakeholder is the current blocker on each stalled opportunity gives a manager something to act on, a call to make, a document to send, a meeting to force. A generic "days since last activity" flag gives a manager nothing but a number to worry about.